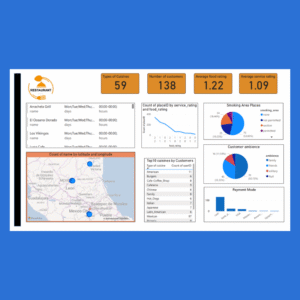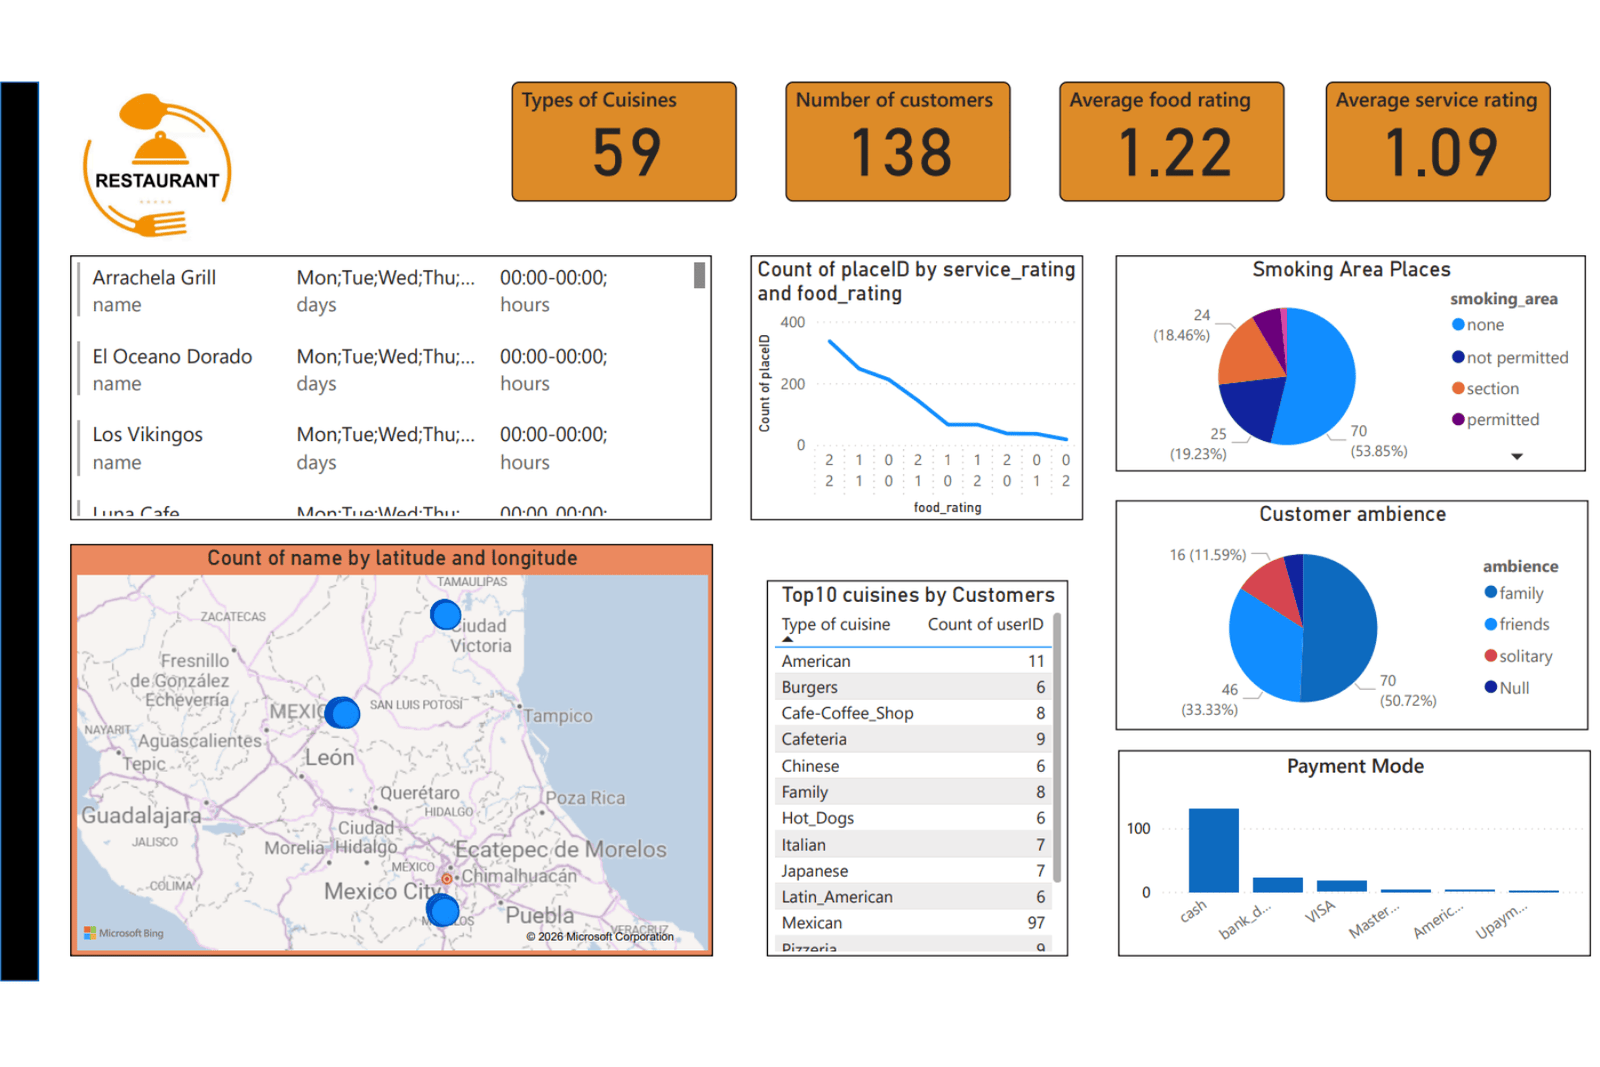
This project presents an interactive Restaurant Analytics Dashboard built in Microsoft Power BI, designed to analyze customer preferences, restaurant characteristics, and dining behavior. The dashboard provides insights into cuisine popularity, customer ratings, payment methods, restaurant ambience, and smoking area availability. It highlights key performance indicators such as 59 cuisine types, 138 customers, an average food rating of 1.22, and an average service rating of 1.09, offering a quick overview of customer satisfaction and restaurant diversity.
The dashboard also allows users to explore the most popular cuisines, analyze customer dining preferences (family, friends, or solitary), and evaluate restaurant attributes such as smoking areas and payment options. Additional visualizations include geographic mapping of restaurants, cuisine popularity rankings, and rating distributions for food and service quality. This project demonstrates practical skills in data visualization, customer behavior analysis, and interactive dashboard development using Power BI to better understand restaurant trends and customer preferences.