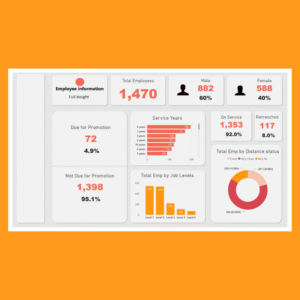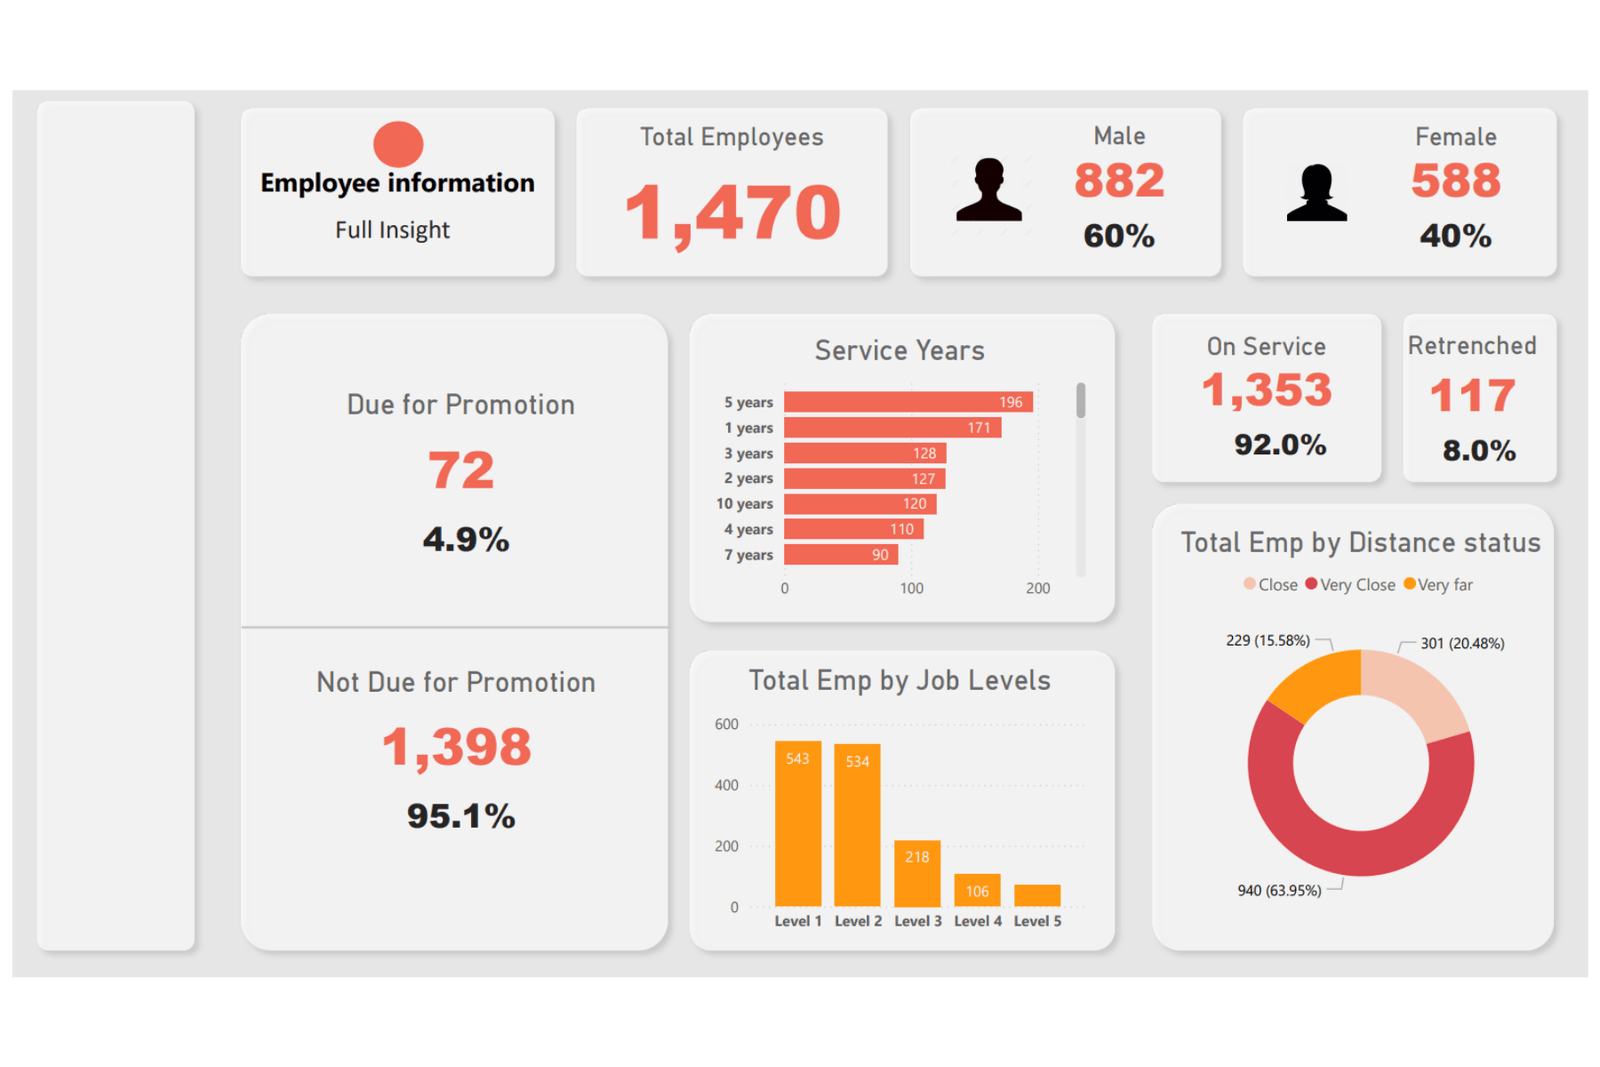
This project presents an interactive HR Analytics Dashboard built in Microsoft Power BI, designed to provide insights into workforce composition, employee distribution, and organizational performance metrics. The dashboard visualizes key HR indicators such as total employees, gender distribution, promotion eligibility, service years, job levels, and employee status. It highlights that the organization has 1,470 employees, with 60% male and 40% female staff, while 72 employees (4.9%) are due for promotion and the majority of employees are currently active in service.
The dashboard also enables deeper analysis of workforce structure by examining employee tenure, job levels, and commuting distance. Additional visualizations help identify how employees are distributed across experience levels and organizational roles, while also monitoring workforce stability by tracking active employees versus retrenched staff. This project demonstrates practical skills in HR data analysis, workforce analytics, and interactive dashboard development using Power BI to support better human resource planning and decision-making.