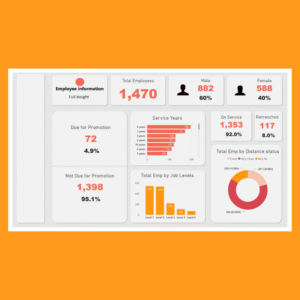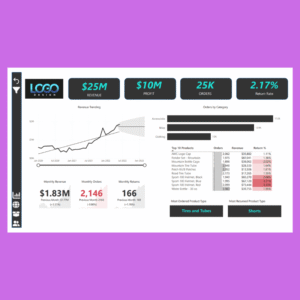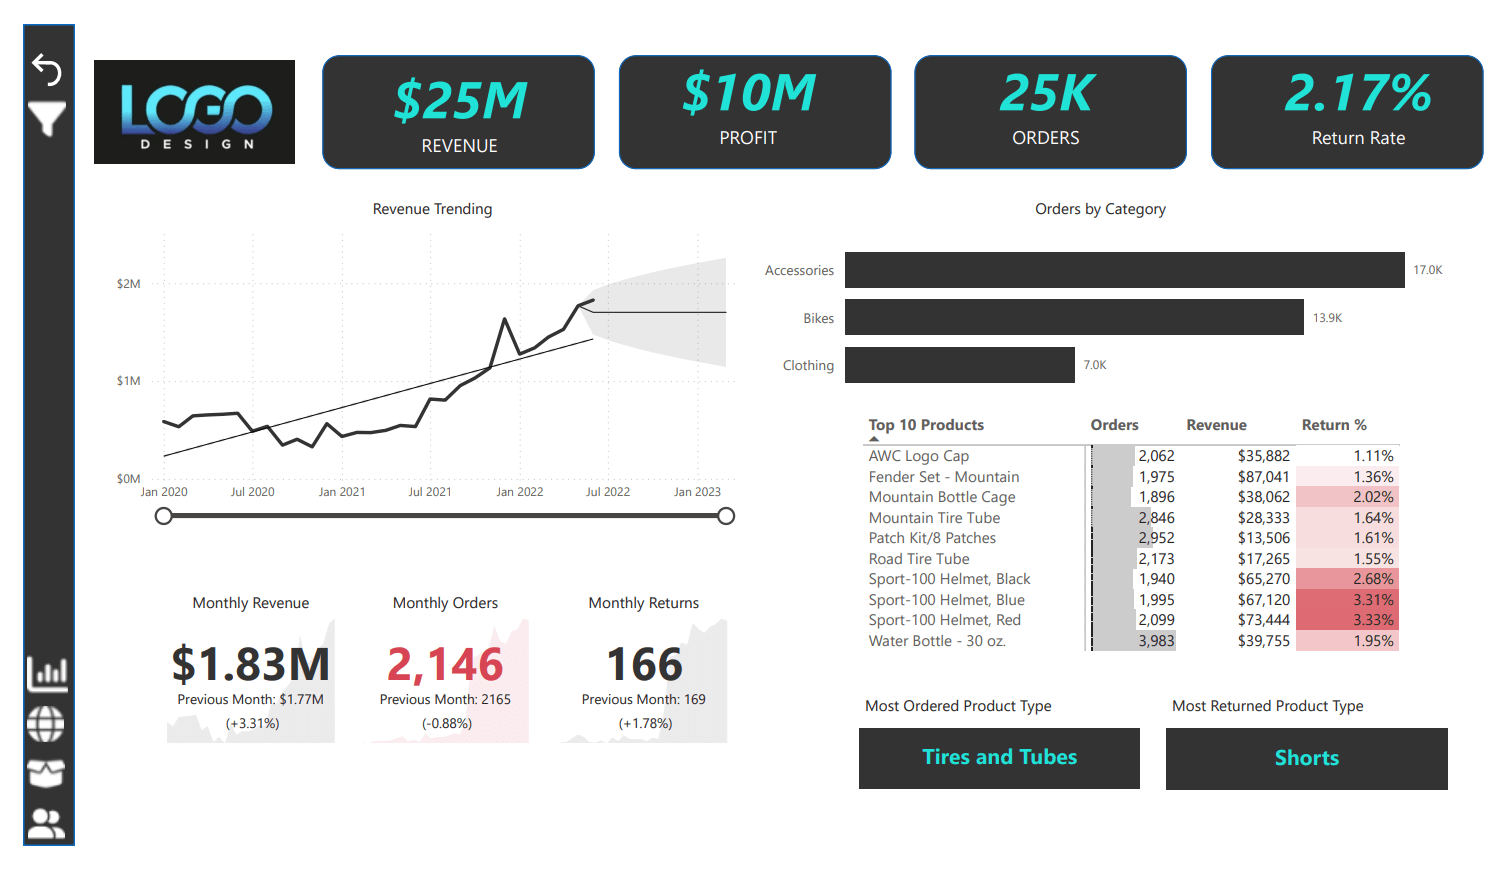
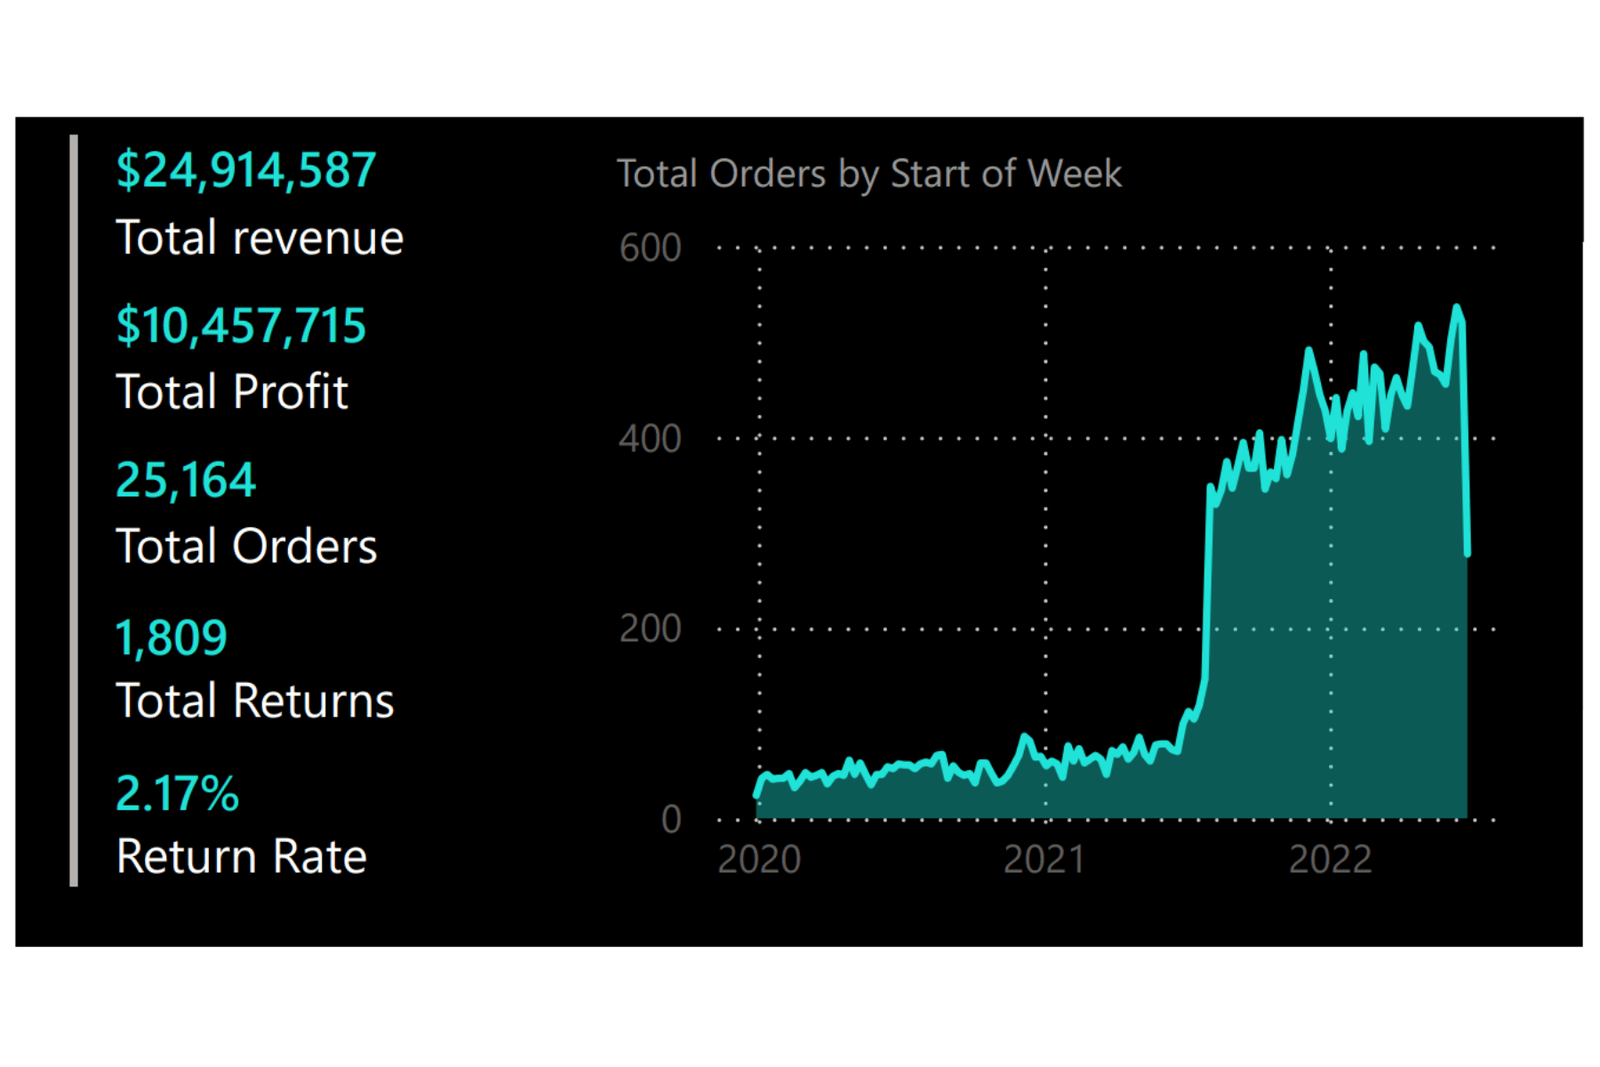
This project presents an interactive Sales Performance Analytics Dashboard built in Microsoft Power BI, designed to analyze key business metrics such as revenue, profit, orders, product returns, customer behavior, and geographic sales distribution. The dashboard transforms raw sales data into clear visual insights through dynamic charts, KPI indicators, and interactive filters, allowing users to quickly understand overall business performance. Key metrics include approximately $25M in total revenue, $10M in profit, 25K orders, and a return rate of 2.17%, providing a high-level overview of operational efficiency and sales performance.
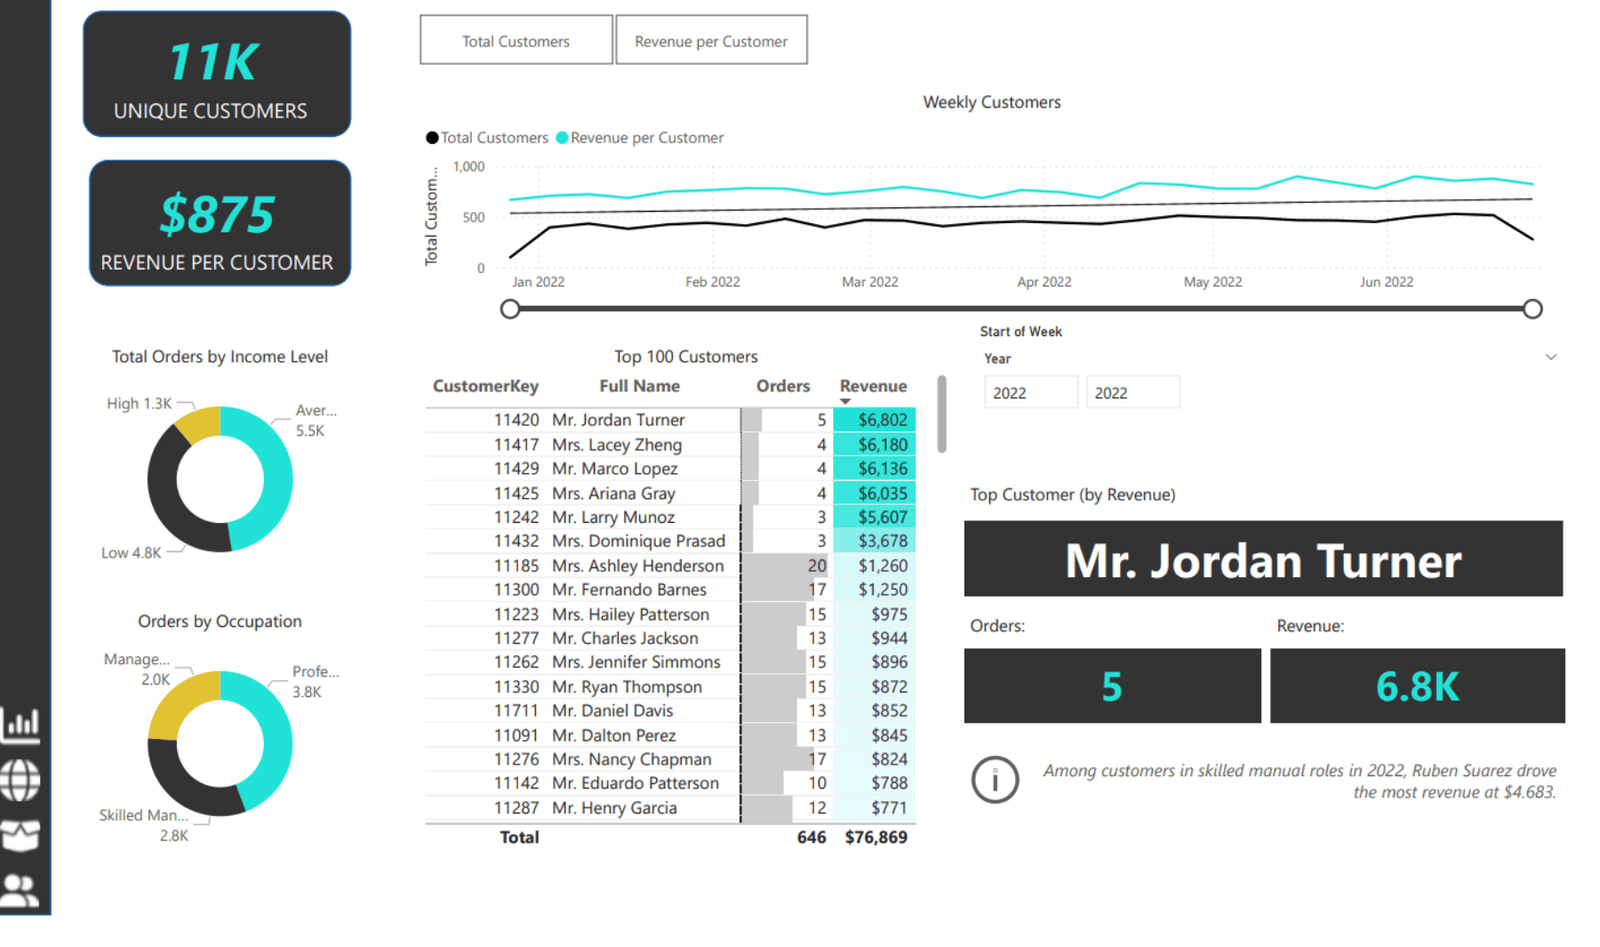
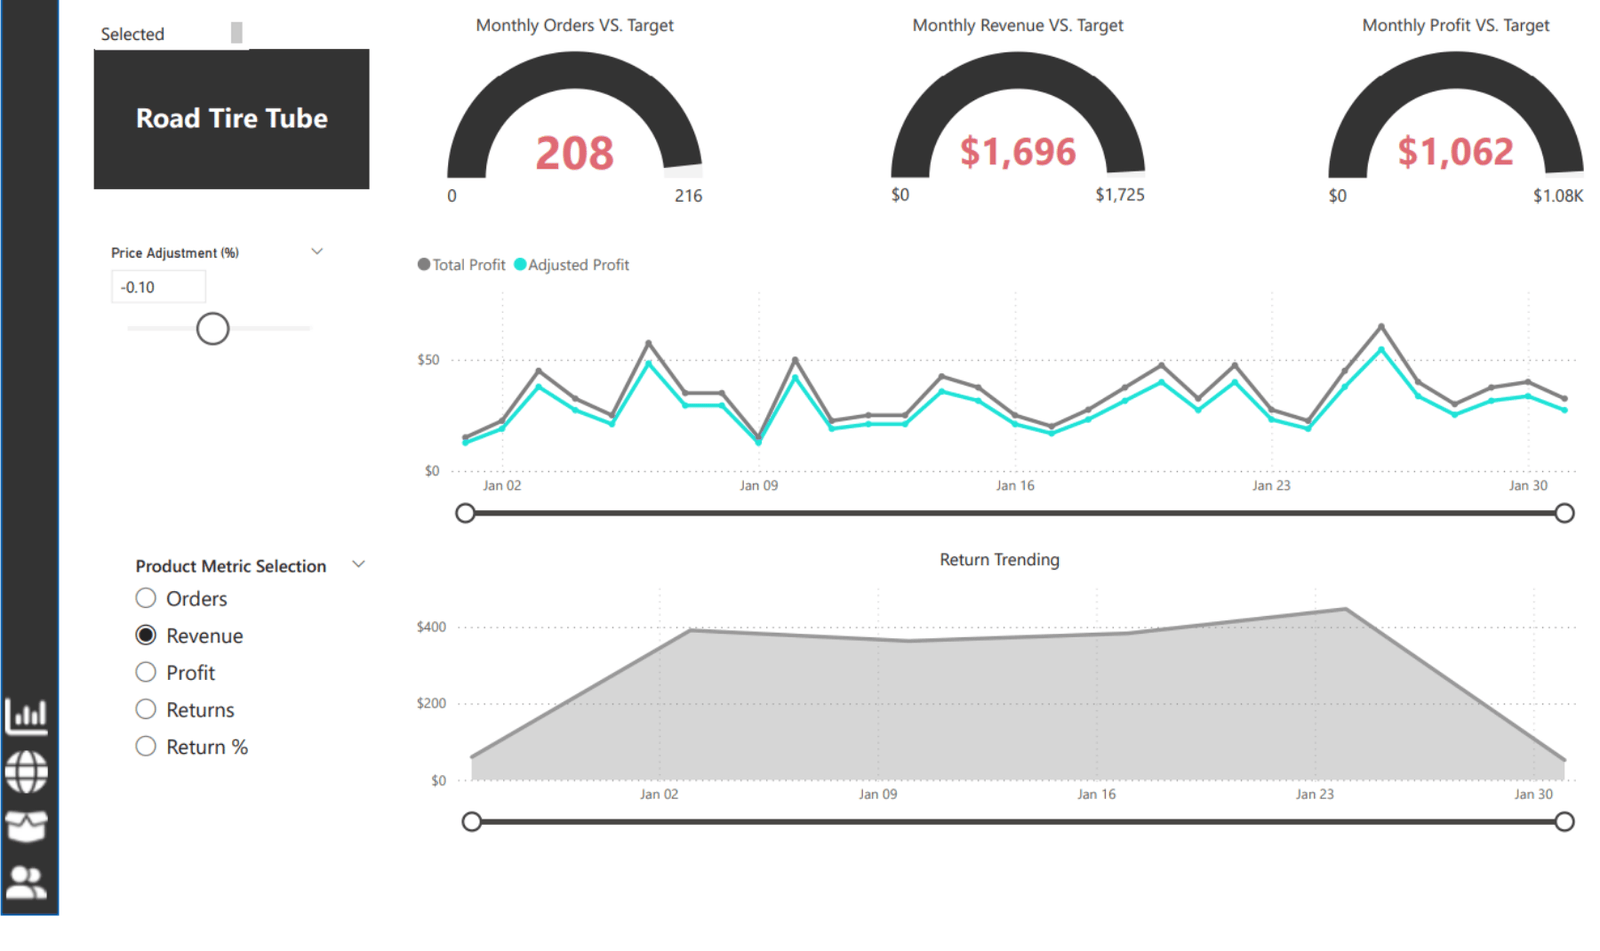
The dashboard enables deeper analysis of product performance, customer segmentation, and regional sales trends. Users can explore top-performing products, evaluate category performance, analyze customer revenue patterns, and monitor sales growth over time. Additional interactive features such as product-level performance analysis and price adjustment simulations allow businesses to evaluate potential changes in pricing strategy and their impact on revenue and profit. This project demonstrates practical skills in data analysis, data modeling, and interactive dashboard development using Power BI to support data-driven decision making.